To monitor the CoVid19 pandemic I knocked up some code to download data from the European Center for Desease Control, and produce some graphs on what it shows.
The code is shown below, with an explanation of what it is doing. The CVid19 reports can be found here.
The code above assigns values to the DATAFILE, URL, and ACTIVEDT variables, which give the URL and filename of the data file, and ACTIVEDT defines the date of the data to download.
There are several definitions of the value for DATAFILE, but only one is not commented out. I switch and swap between the different versions if I miss the cutoff date, or have to rerun a previous file.
if length(countries)>30 then countries=substr(countries,1,30);
if newconfcases=. then newconfcases=0;
if newconfcases<0 then newconfcases=0;
if newdeaths=. then newdeaths=0;
if newdeaths<0 then newdeaths=0;
run;
Here we reformat some data items. We have to do this if the ECDC change the data format. I have left the old formats commented out in the code, simply because the ECDC often change things back again a few days later!
I also create a value for CNTRY, comprising "G" and a numeric count value. I do this to provide a short (8 characters or less) name for graph objects.
Now I summarise DEATHS and CASES by date and country to give daily totals.
proc summary data=temp_cvid1 nway;
var newconfcases newdeaths;
class countries daterep;
id cntry;
output out=cvid_summ(drop=_type_ _freq_) sum=;
quit;
proc sort data=cvid_summ;by countries daterep;run;
Now I need to obtain "lagged" values. Lagged values will allow us to calculate moving average values for the last 7 and 14 days. We can also calculate the number of active_cases, survivors, and the death rate (as a percentage).
These numbers make assumptions about the length of the illness. If a case is active for 14 days, then the patient is assumed to either be cured or dead, which enables us to estimate the number of survivors.
if (cases>0 and deaths>0) then death_rate = deaths/cases;
else death_rate=0;
if cases le 0 then delete;
run;
First I cache the preceding values in the array CS{}, and I clear down the array on the first record of the BY GROUP, to make sure the values from the previous BY GROUP are not picked up by mistake.
When storing the lag values, I use the "MAX(LAG3(CASES),0)" because LAG will return a missing value if the lag value is not yet available, so the MAX function ensures we get at least a "0".
I make a few other assumptions to prevent any "divide by zero" issues, and I prevent negative numbers of deaths, no re-incarnations here! There have been insrances of negative numbers of cases in the data, I remove these records as a data quality issue.
For annotation on some of the graphs, values for the "Next Country", and the "Latest Reported Cases" are required.
The next two steps generate these values, and place them in a SAS dataset called "MAX".
data max;
set temp_cvid_cum;
by countries;
format death_rate percent.;
Latest_Reported_Cases = cases;
Latest_Reported_Deaths = deaths;
if (deaths>0 and cases>0) then death_rate=deaths/cases;
else death_rate=0;
if last.countries then output;
run;
proc sort data=max;by descending countries;run;
data max;
set max;
retain next_country;
output;
next_country=strip(countries);
next_cntry=strip(cntry);
run;
proc sort data=max;by countries;run;
Then I add the static values to the other accumulated data.
Now I calculate the cut-off dates, for the various views on the data that I will graph.
The view of the last 18 days is a "zoomed" view just the last 18 days. The "New" view show only new cases over the last 28 days.
data _null_;
A dummy step
length dt 8. dt1 8.;
dt=date()-18;
today - 18 days
dt1=date()-28;
today - 28 days
put dt= dt1=;
call symput('DT',dt);
call symput('DT1',dt1);
run;
data temp_cvid_cum1_zoom;
set temp_cvid_cum1(where=(daterep ge &dt));
run;
data temp_cvid_cum1_new;
set temp_cvid_cum1(where=(daterep ge &dt1));
run;
Now I setup the output destination, to route the HTML and JPGs to.
filename odsout "d:\data\cvid19\html";
ods _all_ close;
ods html path=odsout
body="covid19.html"
nogtitle device=gif;
Plotting the main graph we use #byval(cntry) in TITLE2 and the graph name.
GPLOT also creates a GRSEG entry in a graphics catalog. Where the name of this entry is duplicated or has more than 8 characters, a WARNING will be put to the log. This can be ignored, as the GRSEG entries are not used.
symbol1 color=BLUE value=dot i=j;
symbol2 color=RED value=dot i=j;
symbol3 color=GREEN value=dot i=j;
symbol4 color=ORANGE value=dot i=j;
title1 "CoVid19 Infections and deaths by country";
title2 "Country: #byval(countries)";
footnote j=l "Data source: Euopean Center for Desease Prevention and Control" j=r "Produced with SAS Software";
Next we create the main menu, which is a simple list of countries, which link to their HTML pages.
ods html path=odsout
body="covid19t.html";
proc sql;
create table countries as select distinct countries as country
from temp_cvid_cum;
quit;
filename main 'd:\data\cvid19\html\main.html';
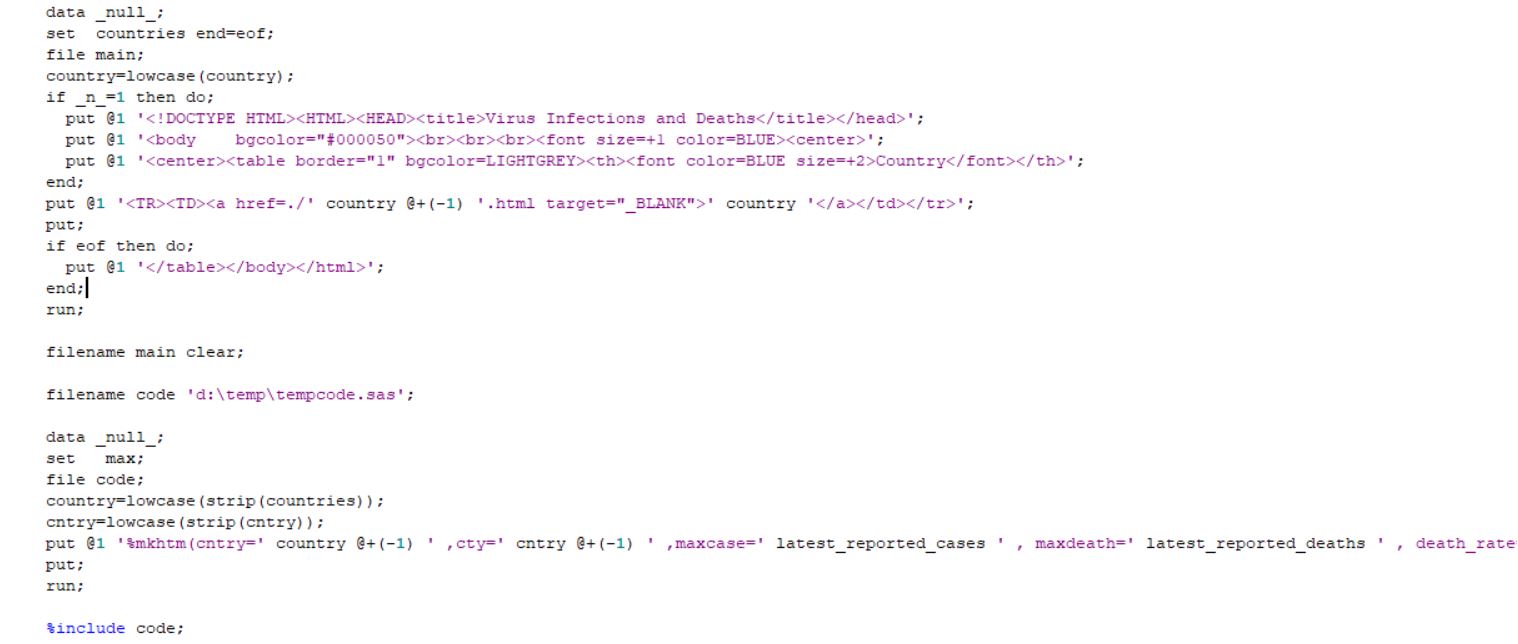
The next bit of code is difficult to format for HTML, so I'm inserting it as an image.
The first DATA _NULL_ step creates the main.html page which contains the list of countries with links to the country main page.
The second step creates a text file containing a macro call for each country. The macro calls to %mkhtm will generate the country main pages.
The "%include code" statement executes the generated code, building the main pages for each country.
Now the pages and images are all in place, we need to move them up to the server. I generate date stamps for the log files, and then use CALL SYMPUT to execute a Windows bat script "run_ftp.bat".
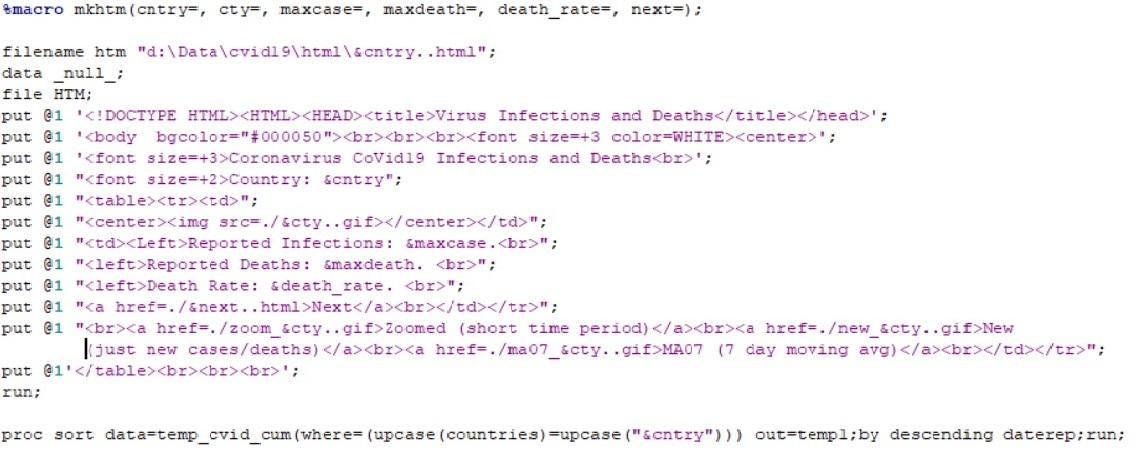
Before we get side-tracked, here is the %mkhtm macro I used to create the country main pages.
The macro %MKHTM create the country main pages. A call to %mkhtm is written to a host file for every country.
The host file is then "%included", causing the macro calls to be executed, creating the main pages.
Once these pages are created, the entire html folder is loaded up onto the web server.